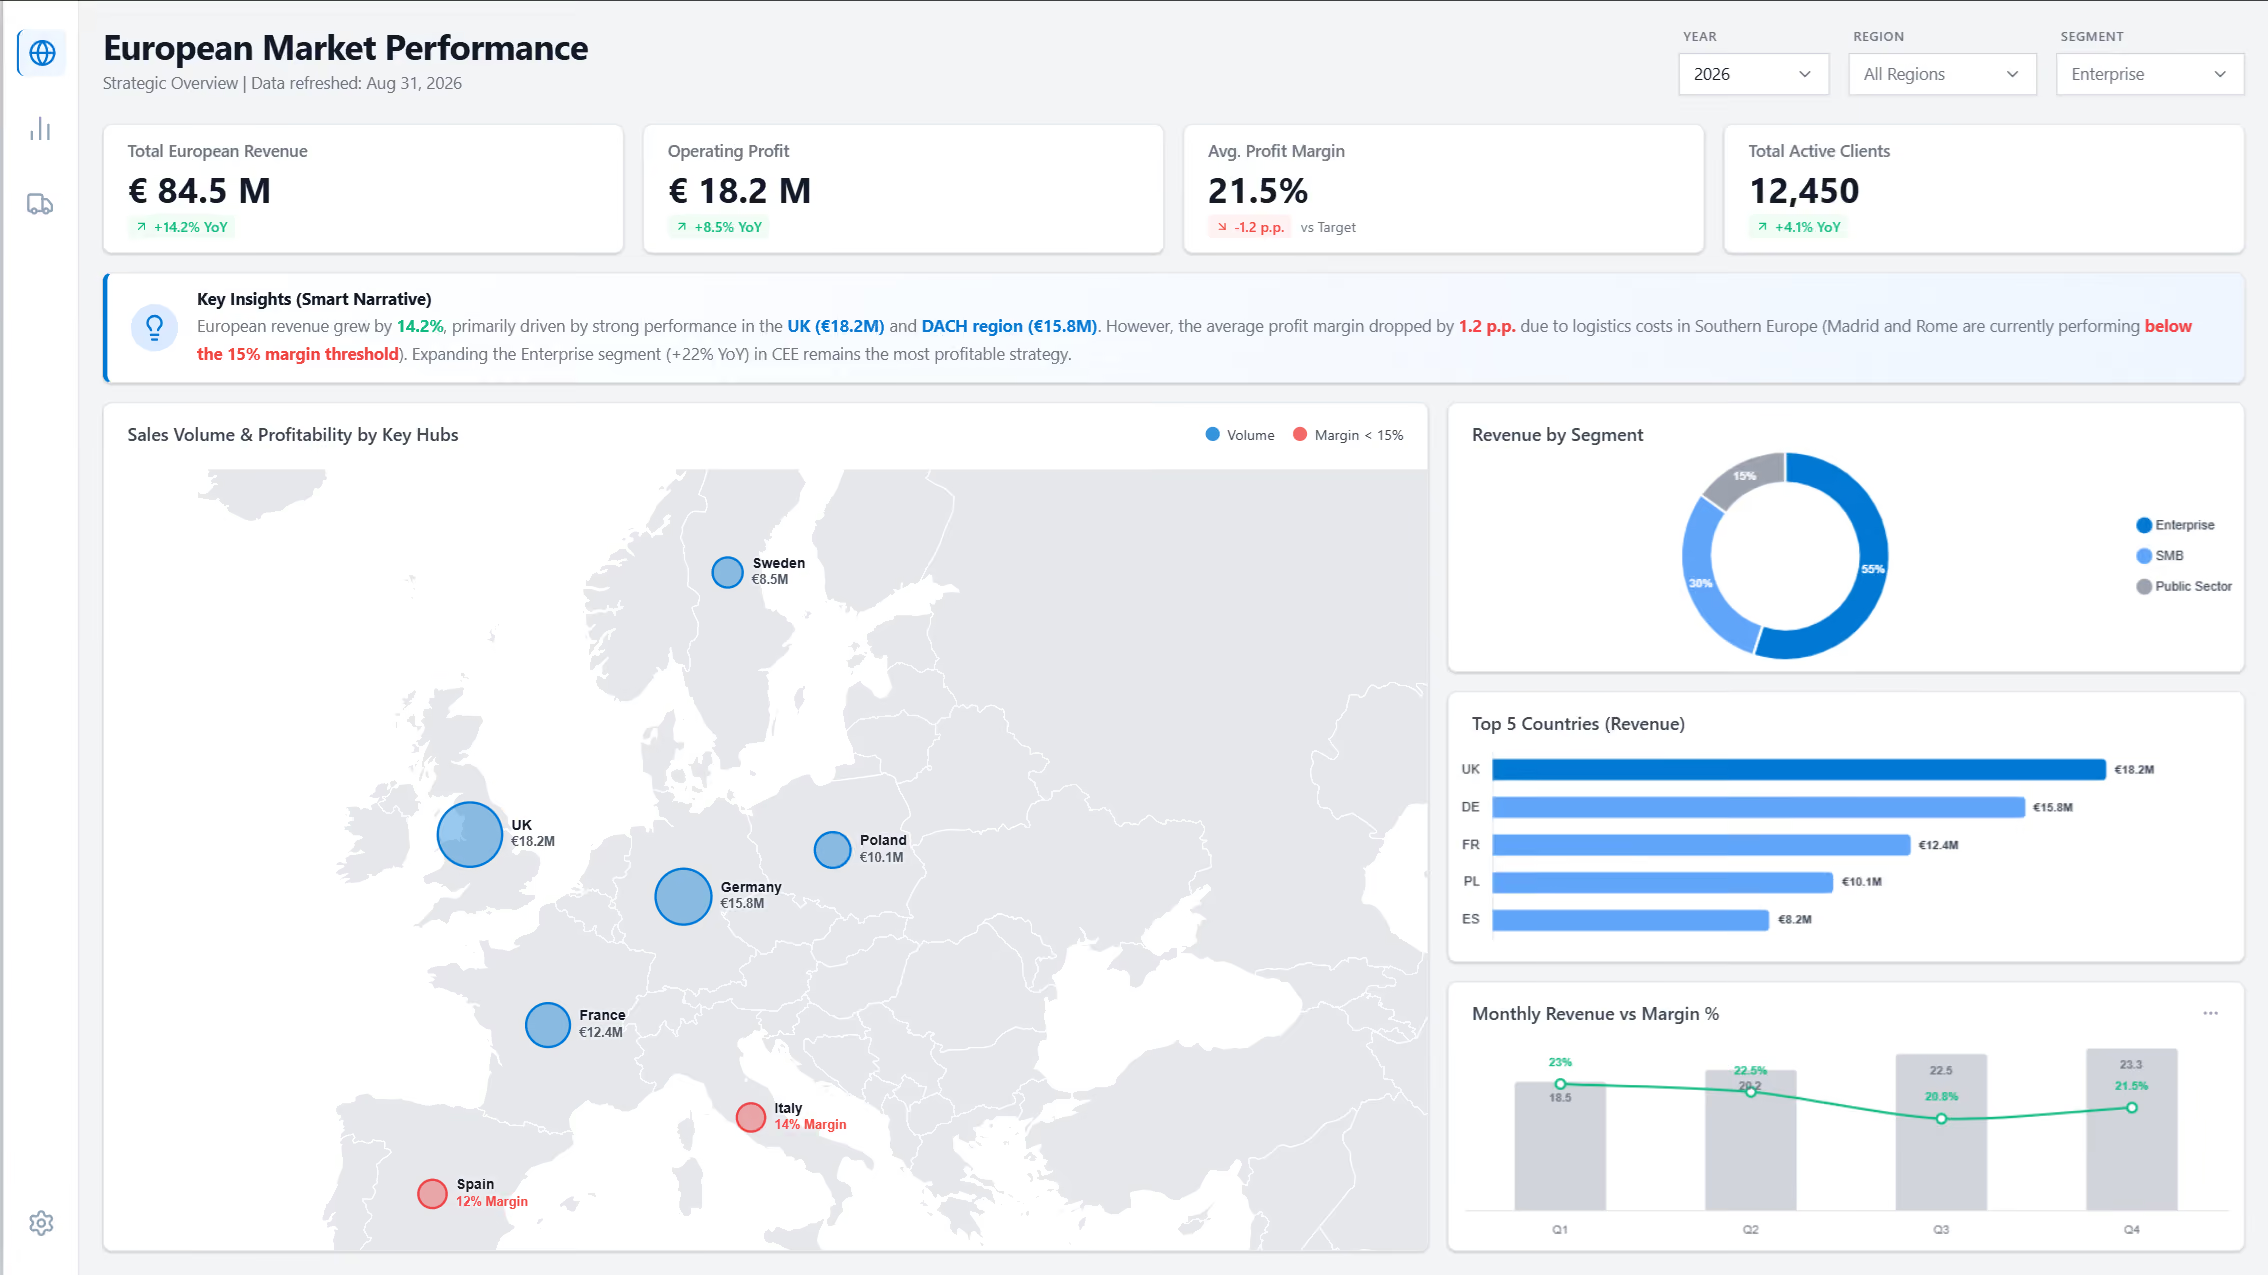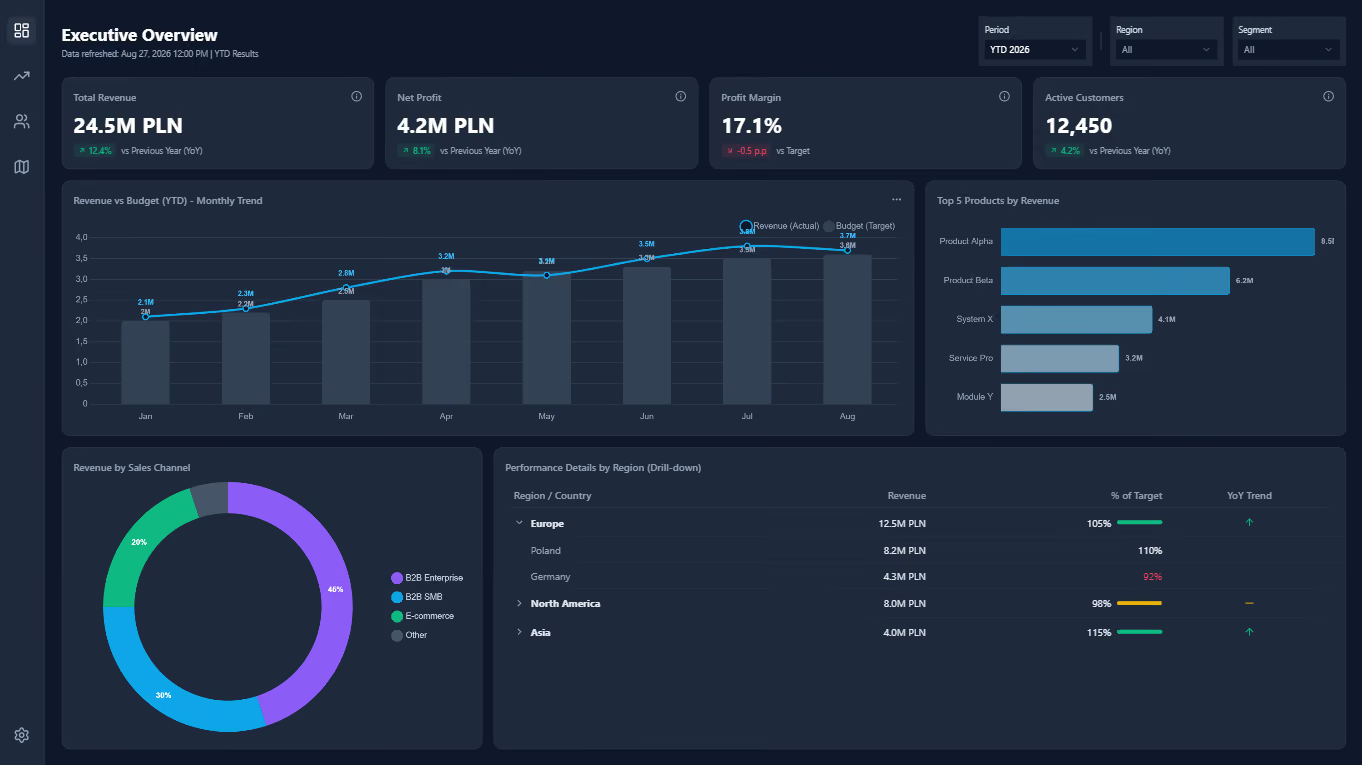
Power BI

Microsoft Power BI transforms data from multiple systems into reports, models, and KPIs, all accessible in one place. We help build business analytics that streamline reporting and support decisions based on reliable data.


The scale of adoption of Power BI confirms the platform's maturity in business analytics.
125h
annual savings
42%
less work for analysts
30 million+
active users
The Challenge

The number of reports is increasing, but the company still does not have a single version of the results

There are several definitions of KPIs

Sales, finance, and operations calculate the same result differently, so the meeting is about reconciling the numbers rather than making decisions or assigning responsibility.

The report is prepared manually

Analysts export and combine data in spreadsheets, which is why insights take time to emerge, and every update requires doing the same work all over again.

The dashboard shows this for no reason

The view indicates a deviation, but does not provide the source data, segment, or owner, so the team does not know where to intervene.

Self-service creates chaos

Without models, certifications, and publication policies, duplicate reports, inconsistent metrics, and permissions that are difficult to control are created.

How It Works

From source data to decisions in a single controlled cycle

Power BI It integrates data sources, organizes KPI logic within a semantic model, delivers analytics to the appropriate roles, and measures whether insights lead to action.

01

Connection

CRM, ERP, files, and data platforms feed into a controlled analytical process.

02

Model

Metrics, relationships, and dimensions together define the outcome and context.

03

Analysis

The report highlights the deviation, trend, cause, and segment requiring attention.

04

Function

An alert, the owner, and the process turn the request into a decision, and the result is fed back into the KPI.

THE LOOP CLOSES WITH DATA
Pillars

The Two Pillars of Power BI: Trusted KPIs and Analytics Used in Decision-Making

Common Data Model and KPIs

Definitions, sources, and access rules are managed outside of a single report.

One definition of a result
A metric has a formula, an owner, a source, a frequency, and exception rules.
Reusable model
The reports use common dimensions, relationships, and certified metrics.
Quality Before Visualization
Audits identify gaps, delays, and discrepancies before KPIs are published.
Role-Based Access
RLS, labels, and permissions restrict data to the appropriate recipient.

Analysis, Adoption, and Action

The report addresses the decision, is available during business hours, and has an owner.
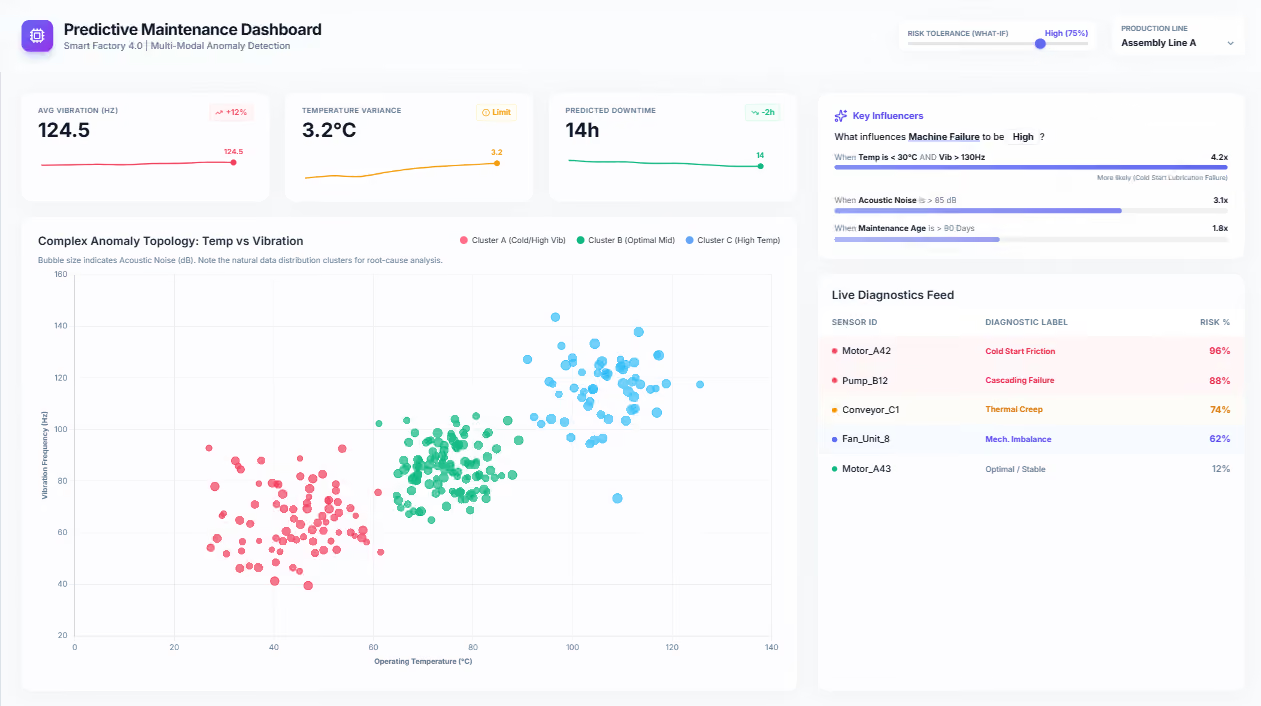
The scene begins with a question
The scope of the report depends on the decision, the response threshold, and the required level of detail.
A deviation leads to the cause
The user navigates from a KPI to a segment, a transaction, and a source event.
The analysis is performed during the process
Teams, apps, and alerts deliver the request to where decisions are made.
Adoption is measured
Usage, time to conclusion, and actions show whether the report adds value.
Photos

See how it works

What Is “ Power BI ” in the Business Management Model?

Power BI It is the business intelligence layer in Microsoft Fabric that combines semantic models, reports, security, and analytics so that data can support repeatable decisions.

Data Merging and Preparation
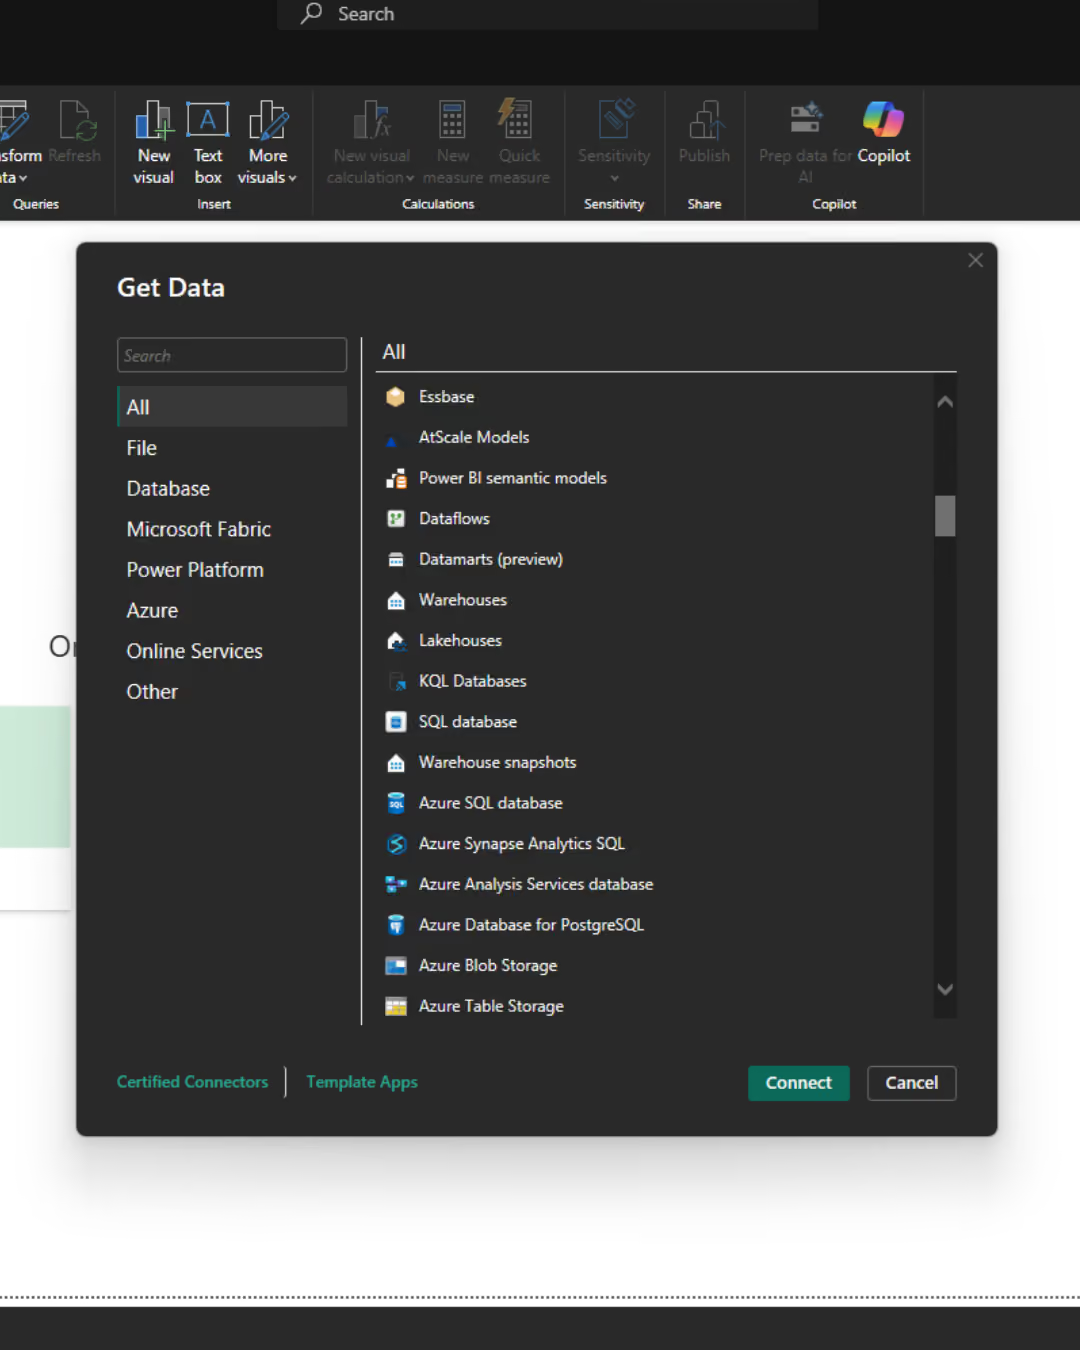
It organizes data from CRM, ERP, files, the cloud, and on-premises systems to reduce the need for manual exports and data reconciliation.
Semantic models and measures
They maintain consistent relationships, dimensions, and logic across KPIs, ensuring that different reports answer the same question in a consistent manner.
Reports and Interactive Analysis
They trace results back to trends, segments, and transactions so that users can more quickly identify the cause and determine a possible course of action.
Distribution and Governance
They integrate workspaces, applications, RLS, and monitoring to ensure that the right data reaches the right roles in a controlled manner.

Take a look inside

Where " Power BI " Creates Value Throughout the Organization

Power BI It integrates customer, financial, and operational results, so that local improvements are also evaluated based on their impact on revenue, costs, cash flow, and quality.
Sales, Marketing, and Customer Service
It combines the pipeline, campaigns, customer journey, SLAs, and retention to assess customer acquisition cost, conversion rate, customer lifetime value, and service quality.
Finance and Management
It integrates P&L, margin, budget, forecast, accounts receivable, and cash flow to detect variances more quickly and identify their causes.
Operations, Logistics, and Manufacturing
It integrates demand, inventory, deliveries, productivity, quality, and OEE to address shortages, downtime, delays, and rising process costs.
What We Optimize

What results have companies using Power BI

20–30%

less time spent searching for data

-50%

time for analysis and decision-making

-40%

reporting errors

-70%

risk identification timeframe

FOR WHOM

For companies where reports are piling up faster than trust in the data

  • Meetings begin with reconciling figures, since departments use different sources, KPI definitions, and report versions.
  • Analysts spend most of the cycle exporting, consolidating, and correcting data, and the findings reach decision-makers after the required deadline.
  • The company has many dashboards, but it doesn't know who owns them, how widely they're used, the quality of the data, or their impact on decisions, so BI costs are rising without any measurable results.
How We Implement

Implementation starts with decisions and data, not with tool configuration

Audit of Decisions and Data

We map out decisions, KPIs, reports, sources, quality, roles, security, licenses, and adoption. We select the process and the pilot baseline.

Implementation Power BI

We are building data flows, a semantic model, metrics, reports, RLS, publishing, and monitoring. We are testing metrics and user scenarios.

Optimization and Scale

We measure usage, time to resolution, quality, and actions. We remove duplicates and improve efficiency, governance, Copilot, and other areas.

Numbers, not slides

What Works for Customers Who Have Placed Their Trust in Us

End-to-end projects across various industries. The same Microsoft tools, different results—because each of our clients’ businesses is unique.

They've placed their trust in us

We save 20–30% of the time spent on daily tasks—time that we used to waste searching for information.

Sławomir Wachowski
Director of the Automation Department
·
SECO/WARWICK Group
Let's talk about technology

Turn technology into results

Tell us what you want to improve. We'll show you how to use this technology to achieve a specific business outcome.