
2 modules
Sales, patient care, and service all in one solution.
Microsoft Fabric is an integrated data and analytics platform that includes integration, lakehouse, data warehouse, real-time analytics, and Power BI. We help streamline your data architecture and shorten the path from source to decision.


Separate tools for integration, data storage, and reporting result in duplicate data, inconsistent KPI definitions, and rising maintenance costs.
Long loading times and manual data preparation delay the analysis, so decisions are made based on an outdated picture of the situation.
Departments build their own models and spreadsheets, so the same metrics yield different results, and meetings are used to reconcile numbers rather than make decisions.
Undescribed, inconsistent, and hard-to-access data limit the quality of models and agents, which is why AI projects remain at the experimental stage.
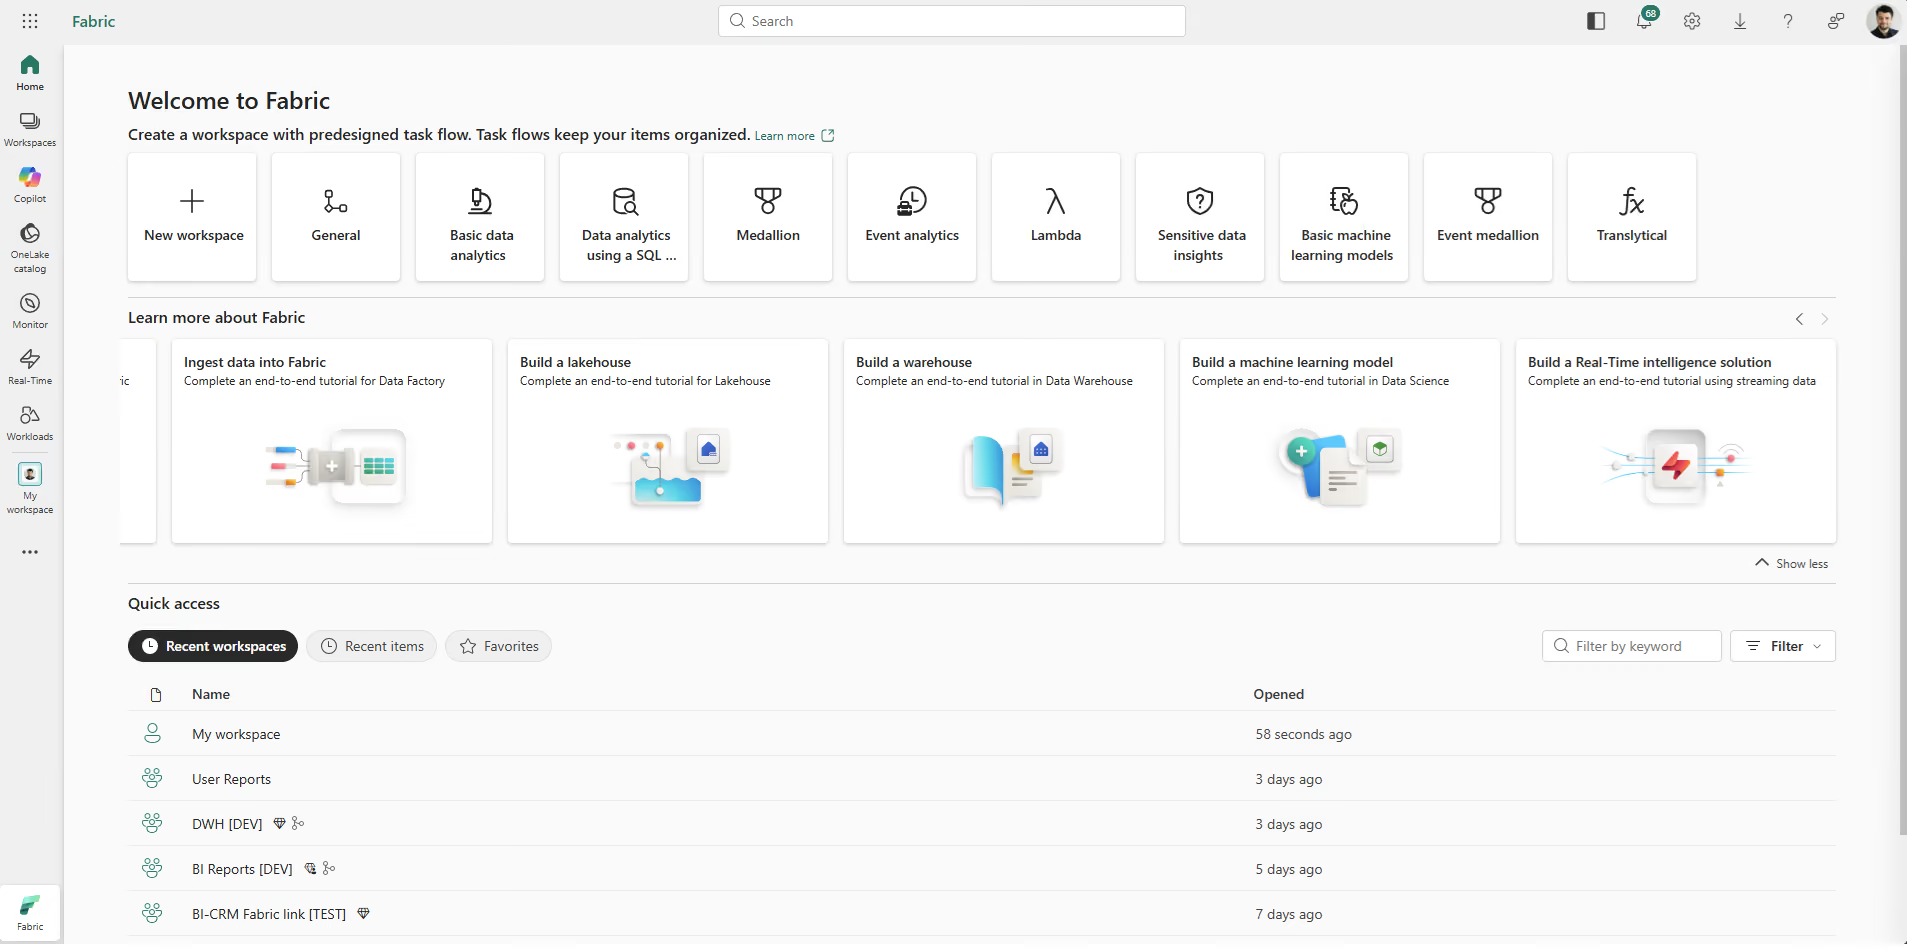
Fabric It integrates data into OneLake, allows you to prepare and share it with multiple teams, and then use it for Power BI, real-time analytics, and AI.
Select the data you want to copy, replicate, stream, or share via shortcuts.

Define the data, quality standards, owners, and common metrics for the selected area.
Power reports, real-time analytics, data models, and AI solutions.
Monitor the quality, capacity utilization, costs, and value of each use case.
OneLake and a shared working model minimize duplication, point integrations, and multiple versions of the same data.

The same ecosystem supports reporting, real-time events, advanced analytics, and data for AI.
.avif)
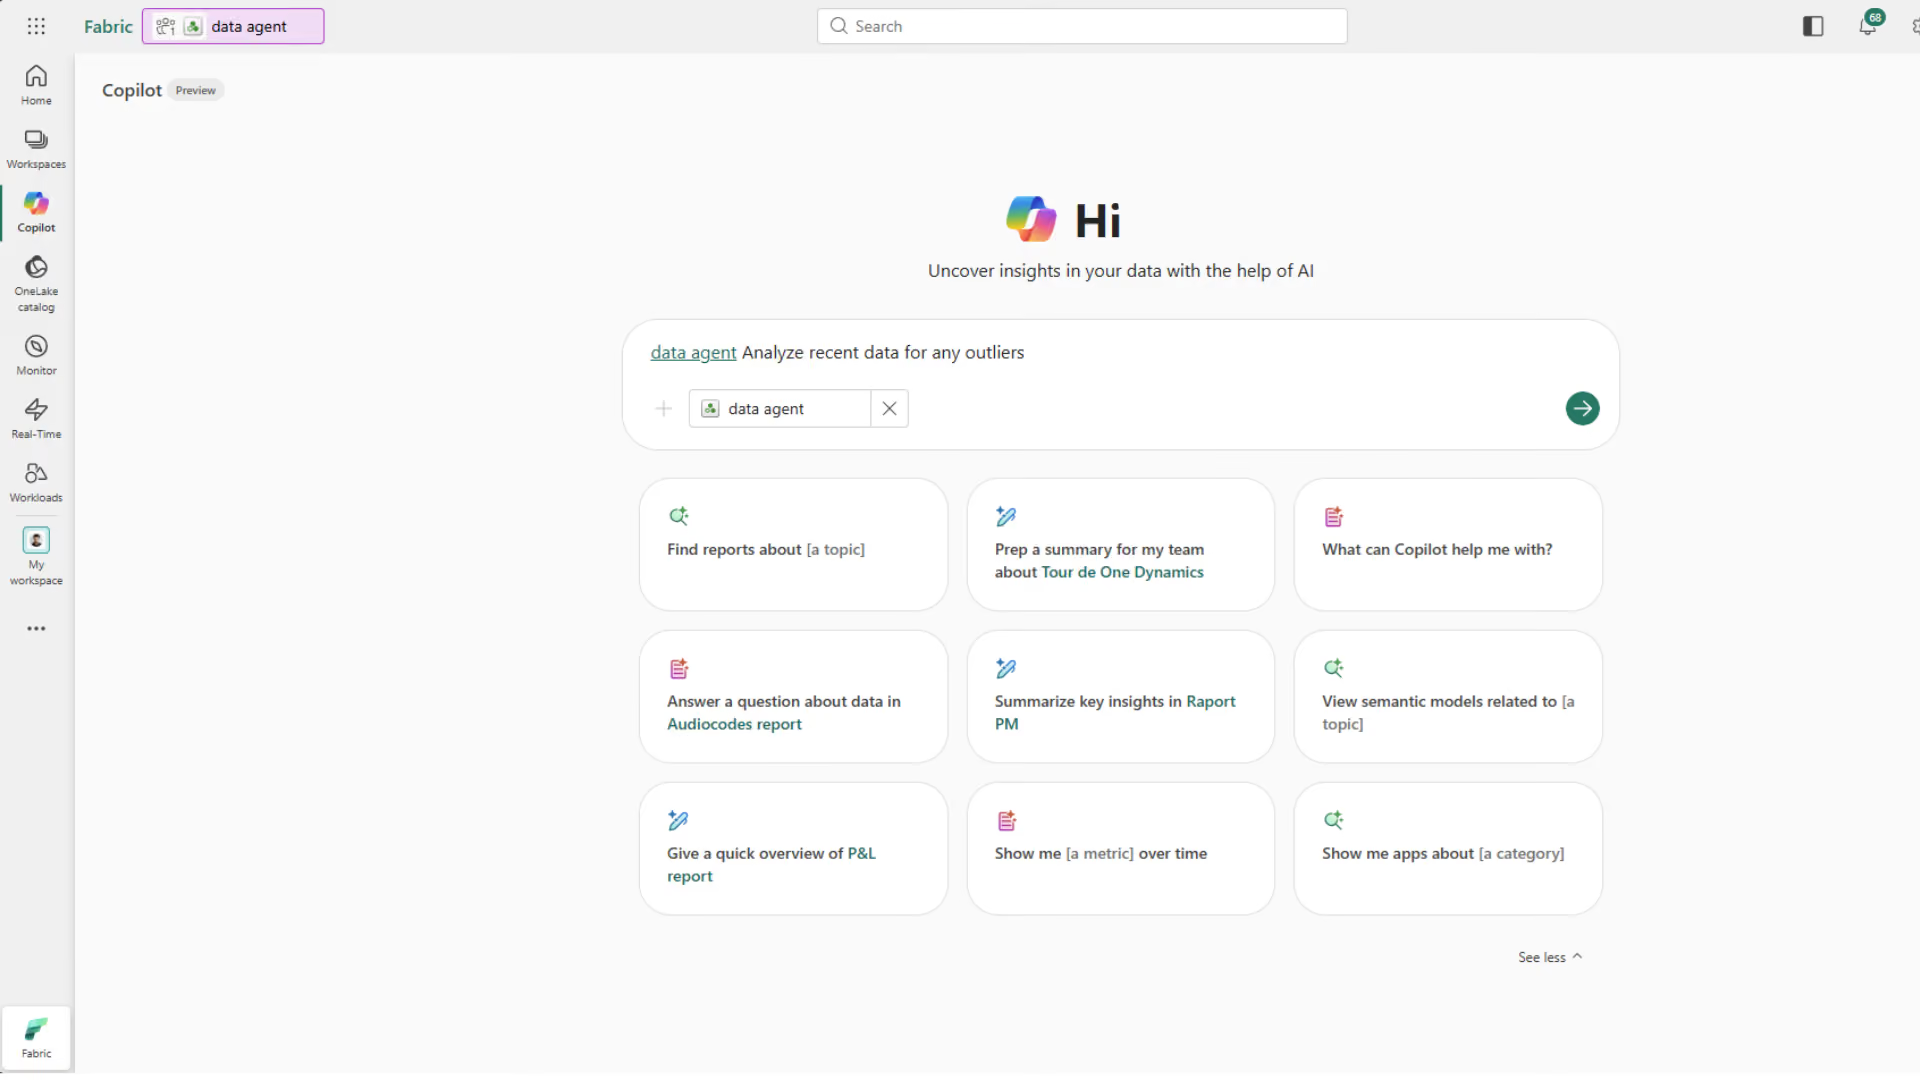
Microsoft Fabric is a SaaS platform that combines integration, data engineering, data warehousing, real-time analytics, data science, and Power BI on the OneLake foundation.
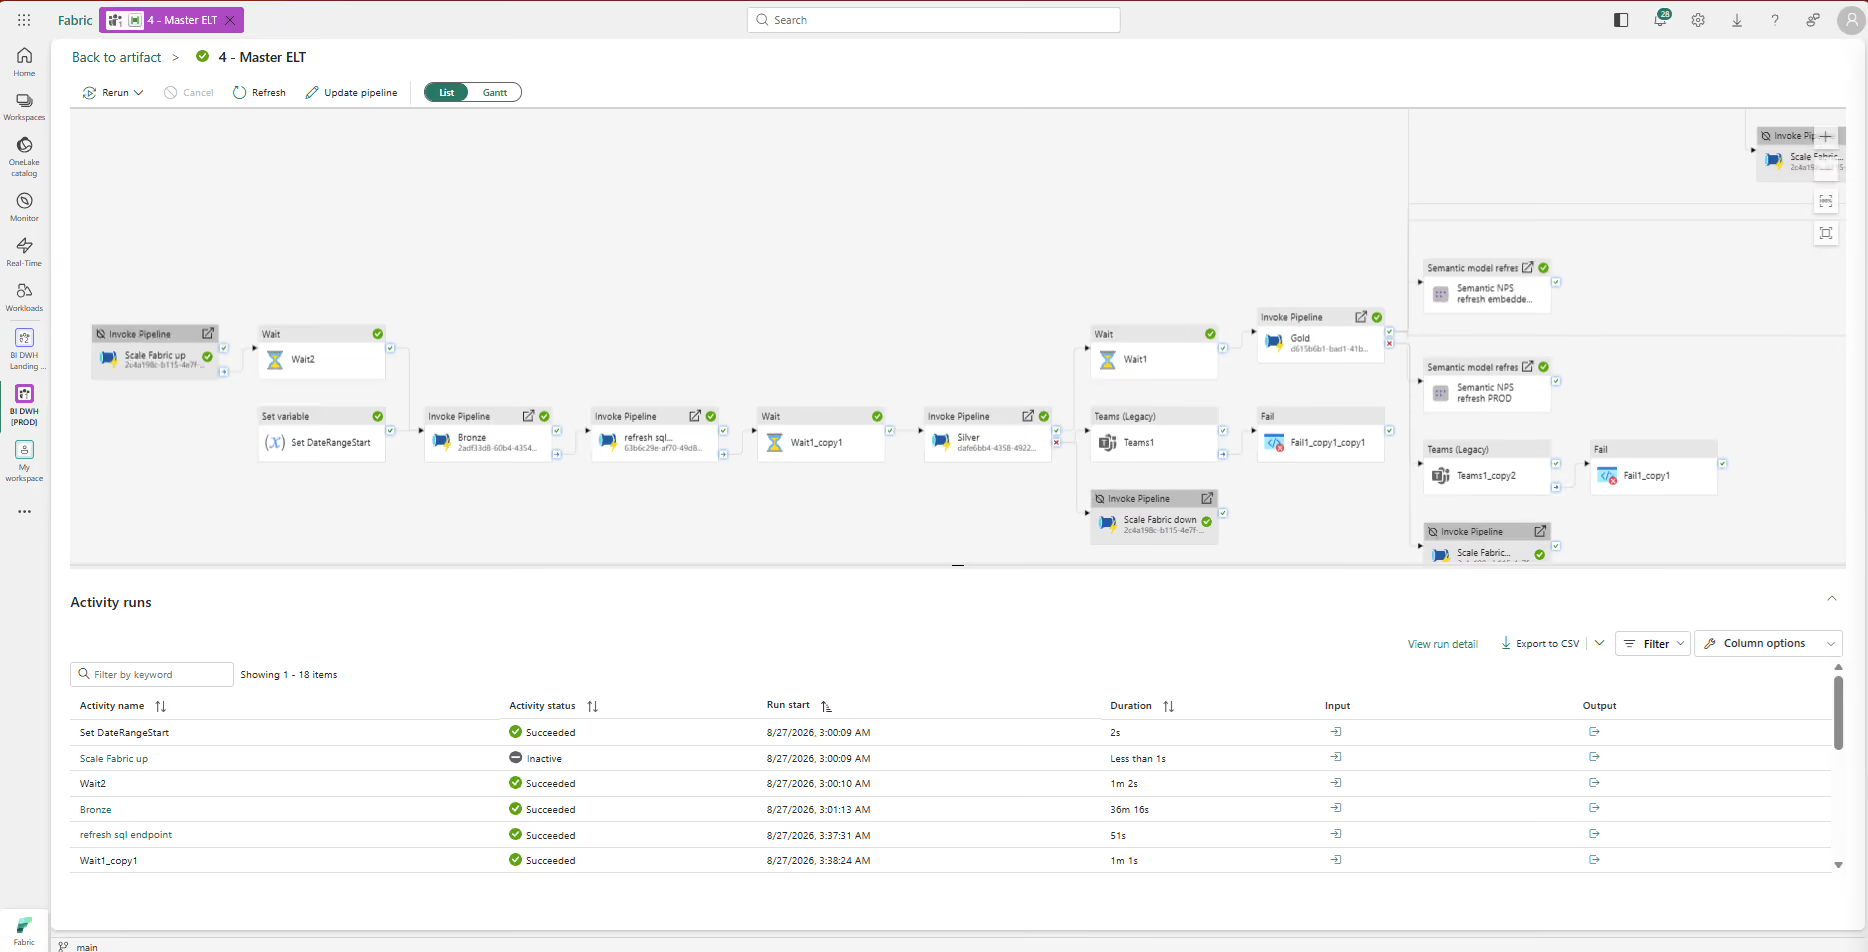
The platform is ideal for situations where multiple systems feed into shared KPIs, reports need to be generated more quickly, and data is intended to support operations and AI.
800 hours per month
time saved through reporting
87%
faster implementation of customer data
90 minutes
reporting instead of two days
15 hours per week
time saved by the BI team
End-to-end projects across various industries. The same Microsoft tools, different results—because each of our clients’ businesses is unique.
Sales, patient care, and service all in one solution.
Less time spent searching for information every day.
Less time needed to verify customer data in public records.
Operations and processes completed in half the previous time.

“
We save 20–30% of the time we spend on daily tasks—time that we used to waste searching for information.
”

Tell us what you want to improve. We'll show you how to use this technology to achieve a specific business outcome.


.avif)
.avif)